In 2023 Clear Roads continued a multi-year project to systematically gather, compile and analyze a range of data from state DOTs related to their winter operations.
All state DOTs were invited to participate in a survey to collect information about their winter resources, materials and costs for the winter season from July 1, 2022 to June 30, 2023. This complements data previously collected from the past eight winter seasons (2014-2015 through 2021-2022). The results of this survey are linked below.
Clear Roads plans to continue conducting this survey in the future, compiling multiple seasons of data. Survey results for upcoming winters will be added to this page once each year’s data analysis is completed.
This project was featured in an article in the September 2016 issue of Roads & Bridges magazine.
Current-Year Data
[download id=”18687″]
Microsoft Excel file (xlsx), updated March 5, 2024
Forty-one states responded to this survey. The following information can be found on the tabs of this spreadsheet:
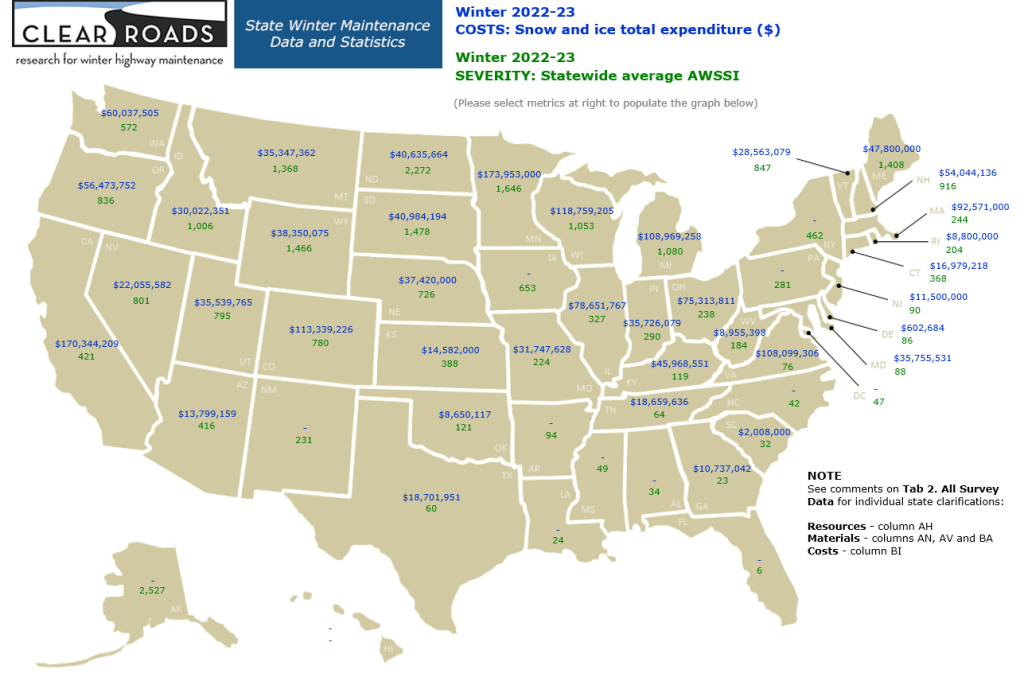
Tab 1. Interactive Map. On this tab users may graphically display one or two survey metrics on a map of the United States using interactive boxes.
NOTE: If the interactive map features are not working, you may need to exit Microsoft Excel’s Protected View mode. Please select “Enable Editing” if prompted.

Tab 2. Collected Data. This tab compiles all survey data from this year and previous years.
Tab 3. Calculated Statistics. This tab includes additional derived statistics from this year’s and previous years’ data sets (such as the ratio of full-time workers to part-time workers and the total dry chemicals applied per lane mile).
Tab 4. Average Values. This tab presents running averages across the most recent five years of the survey.
Tab 5. Changes in Value. This tab presents increases or decreases across the most recent two years of the survey.
Tab 6. Average AWSSI State and City. This tab includes Accumulated Winter Season Severity Index (AWSSI) data for each municipality from which the the statewide AWSSI averages are derived.
Tab 7. User-Generated Map. This tab allows users to display custom data on a map of the United States by pasting it into a table of states.
Previous Years’ Data
[download id=”15843″]
Microsoft Excel file (xlsx), updated December 19, 2022
[download id=”14152″]
Microsoft Excel file (xlsx), updated December 20, 2021
[download id=”11865″]
Microsoft Excel file (xlsx), updated December 29, 2020
[download id=”10695″]
Microsoft Excel file (xlsx), updated July 15, 2020
[download id=”8959″]
Microsoft Excel file (xlsx), updated April 4, 2019
[download id=”5956″]
Microsoft Excel file (xlsx), updated February 2, 2018
[download id=”4394″]
Microsoft Excel file (xlsx), updated December 21, 2016
[download id=”3676″]
Microsoft Excel file (xlsx), updated May 31, 2016